Market Snapshot for Austin Retail Real Estate
We’ve compiled a range of the latest key statistics for Austin retail real estate. This includes: vacancy rates, absorption rates, rental rates, and the latest property transactions. The Austin retail report is updated quarterly by our commercial real estate experts.
In order to get a better idea of the economic situation overall in Austin, here are some key highlights pulled from our guide for Reasons to Invest in Austin Commercial Real Estate:
– Austin is the 2nd Fastest GDP in terms of growth in the country currently.
– Austin has the 11th largest economy vs other cities in the USA.
– Austin is considered to be the Tech Hub of the South.
– Austin’s population is predicted to keep booming; it may even surpass New York metro’s population by the end of the century.
Before we get into the specific statistics for Austin’s retail real estate market in Q2 2024, let’s give some context of the bigger picture with capital market figures for the retail sector.
Austin Retail Real Estate Statistics: Leases, Sales, and Projects Under Construction – Q2 2024
Here’s a summary of the statistical highlights, latest retail transactions, vacancy / lease trends, and current market activity for Austin, TX. The analysis below is derived and compiled from leasing stats, latest transactions, and projects under construction in order to further understand the overall state of the retail real estate market in Austin.
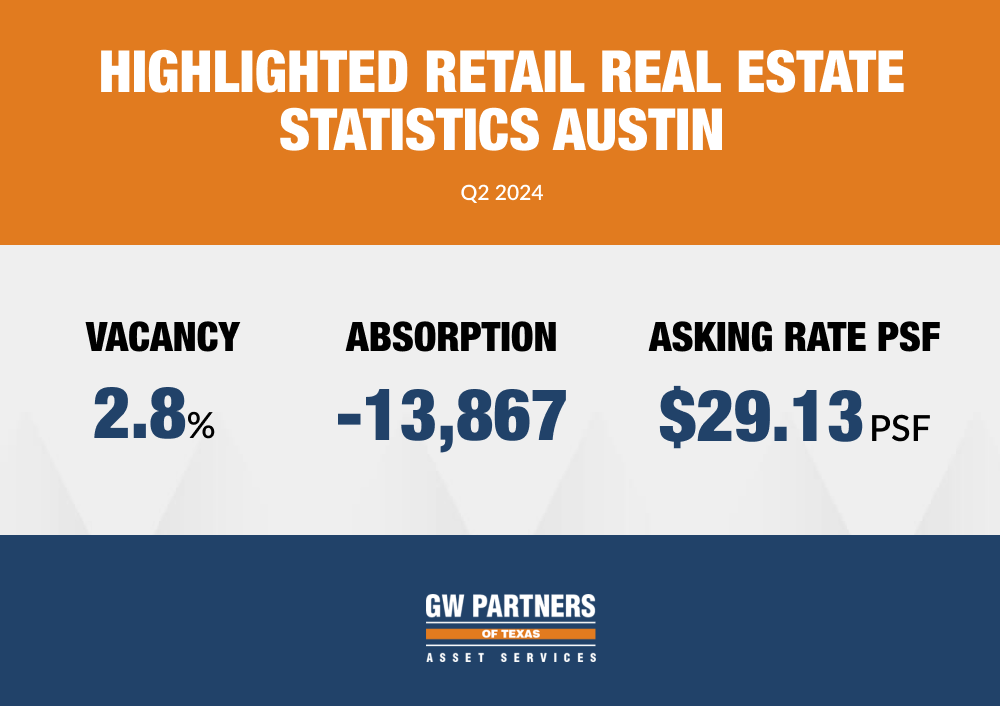
Highlighted Retail Real Estate Statistics Austin – Q2 2024
- Vacancy: 2.8%
- Absorption: -13,867
- Asking rate PSF: $29.13
Primary Retail Real Estate Statistics in Austin – Past 12 Months
12 Month Deliveries in SF: 1.9M
12 Month Net Absorption in SF: 1.9M
Vacancy Rate: 2.8%
12 Month Rental Growth: 4.4%
Top Retail Real Estate Leases in Austin – Past 12 Months
1. Manor Crossing – Far Northeast
Tenant: The Home Depot
Size: 135,000 SF
Tenant Rep Co: Not Listed
Leasing Rep Co: Not Listed
2. Life Time – South
Tenant: Life Time
Size: 109,045 SF
Tenant Rep Co: Not Listed
Leasing Rep Co: Not Listed
3. 2705 N Main St – Georgetown
Tenant: Tesla
Size: 62,400
Tenant Rep Co: HPI Real Estate
Leasing Rep Co: Capital Lease Management
4. Braker Lane Village – Northwest
Tenant: Hobby Lobby
Size: 58,000 SF
Tenant Rep Co: Not Listed
Leasing Rep Co: Not Listed
5. Braker Lane Village – Northwest
Tenant: Hobby Lobby
Size: 58,000 SF
Tenant Rep Co: Not Listed
Leasing Rep Co: Not Listed
Retail Real Estate Sales Statistics in Austin – Past 12 Months
Over the last 12 months there have been 284 total retail real estate transactions in Austin with an average cap rate of 6.1%. The average price per square foot at the time of sale was $418, and the average vacancy was 8.5%.
Sales Comparables: 284
Average Cap Rate: 6.1%
Average Price/ SF: $418
Average Vacancy at Sale: 8.5%
Top Retail Real Estate Sales Transactions in Austin – Q2 2024
1. Life Time – 7101 S Mo Pac Expy
Price: $40,000,000
Size: 109,045 SF
Price/ SF: $367
Cap Rate: Not Listed
Vacancy: 0%
2. 145 Lehman Rd
Price:$9,111,620
Size: 6,463 SF
Price/ SF: $1,410
Cap Rate: 6.6%
Vacancy: 0%
3. 5819 Burnet Rd
Price: $8,116,800
Size: 10,400
Price/ SF: $780
Cap Rate: 5.2%
Vacancy: 0%
4. Pet Paradise Georgetown – 716 S Interstate 35
Price: $7,000,000
Size: 19,529 SF
Price/ SF: $358
Cap Rate: 6.9%
Vacancy: 0%
5. 2313 S Colorado St
Price:$4,930,645
Size: 22,010 SF
Price/ SF: $224
Cap Rate: 6.3%
Vacancy: 0%
Retail Real Estate Projects Under Construction in Austin – Past 12 Months
At the moment there are 100 retail assets / properties under construction in the Austin market representing over 1.7M square feet of new space. This represents 1.4% of the total retail real estate inventory and nearly 44.9% of the total space is pre-leased.
Below the stats you’ll find the top-5 largest retail projects currently under development.
Properties Currently Under Construction: 100
Total Size:1,760,107
Percent of Inventory: 1.4%
Pre-leased: 44.9%
Top Retail Real Estate Projects Under Construction Austin – Past 12 Months
1. EastVillage
Size: 223,435 SF
Completion Date: Q1 2025
Developer/ Owner: Not Listed
Stories: 1
2. H-E-B – 2400 S Congress Ave
Size: 145,000 SF
Completion Date: Q3 2024
Developer/ Owner: Not Listed
Stories: 3
3.Food Pad D – E Crystal Falls Pky
Size: 80,100 SF
Completion Date: Q3 2024
Developer/ Owner:PREMAS Commercial Realty Group
Stories: 1
4. The Co-Op District – Co-Op District
Size: 70,000 SF
Completion Date: Q2 2024
Developer/ Owner: MA Partners
Stories: 4
5. The Commons at Rivery – 1313 Williams Dr
Size: 40,000 SF
Completion Date: Q3 2024
Developer/ Owner: Not Listed / Not Listed
Stories: 1
Data sources: GWPTX & CoStar
